
Baby Growth Chart: Understanding Percentiles and What They Mean
Demystify growth charts and percentiles. Learn what the numbers mean and when to consult your pediatrician.
If you have taken your baby to a well-child visit, you have almost certainly heard the word "percentile." Your pediatrician may have said something like "your baby is in the 40th percentile for weight" or "head circumference is tracking along the 75th." For many parents, these numbers trigger an immediate emotional reaction—pride when the number seems high, anxiety when it seems low. But percentiles are frequently misunderstood, and a clear grasp of what they actually represent can save you considerable worry.
What Growth Charts Measure
Pediatric growth charts track three primary measurements during the first two years of life:
- Weight: The most frequently tracked metric. Babies are weighed at nearly every visit because weight changes can be an early indicator of nutritional issues or illness.
- Length (height): Measured while the baby lies down until age two, then standing up. Length is a long-term indicator of overall growth and nutrition.
- Head circumference: A proxy for brain growth. Rapid increases or a plateau in head circumference can signal conditions that warrant investigation, though most variations are perfectly normal.
After age two, body mass index (BMI) is often added to the mix, but for infants and toddlers, the three measurements above are the standard.
WHO Charts vs. CDC Charts
Two sets of growth charts are commonly used in the United States, and they are not identical.
The WHO Growth Standards were released in 2006 and are based on a large international study of healthy, breastfed children from six countries. They describe how children should grow under optimal conditions. The CDC and the American Academy of Pediatrics recommend using WHO charts for all children under age two, regardless of feeding method.
The CDC Growth Charts, published in 2000, are based on a reference population of American children from the 1960s through the 1990s. They describe how children did grow in that particular sample. CDC charts are recommended for children aged two and older.
The practical difference matters most for breastfed babies. Because the older CDC data included a higher proportion of formula-fed infants—who tend to gain weight somewhat faster in the second half of the first year—a breastfed baby can appear to "fall off the curve" on a CDC chart even when growing perfectly normally. Using the WHO chart avoids this misleading signal.
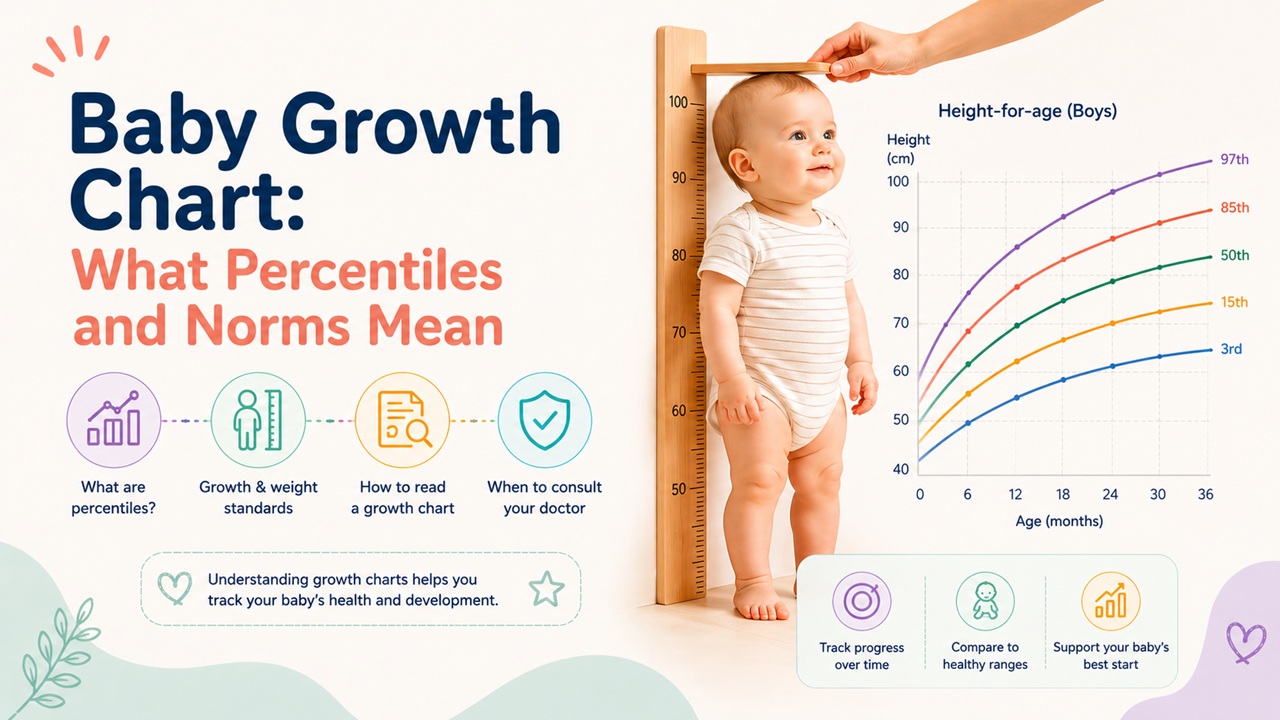
What Percentiles Actually Mean
A percentile is simply a comparison point. If your baby is at the 30th percentile for weight, it means that out of 100 healthy babies of the same age and sex, about 30 would weigh the same or less, and about 70 would weigh more. It does not mean your baby scored a 30 on some test or is somehow deficient.
There is no "ideal" percentile. A baby at the 10th percentile is not less healthy than one at the 90th. Genetics play an enormous role. If both parents are petite, their baby is likely to plot on lower percentiles—and that is exactly where that baby belongs. Similarly, tall parents often produce babies who track along higher percentiles.
Common Myths About Percentiles
Myth: Higher percentile = healthier baby. This is perhaps the most pervasive misconception. Health is about consistent growth along the baby's own curve, not about being at the top of the chart. A baby who consistently tracks along the 15th percentile is growing beautifully.
Myth: Percentiles should always go up. It is normal for a baby's percentile to shift somewhat during the first 18 months as they settle into their genetically determined growth trajectory. A baby born large who gradually moves from the 80th to the 50th percentile may simply be finding their natural channel.
Myth: A single measurement tells the whole story. One data point is nearly useless in isolation. Growth is a trend, not a snapshot. Two or three measurements plotted over time reveal the pattern—and it is the pattern that matters.
Myth: Growth charts predict adult size. A baby at the 95th percentile will not necessarily be a tall adult. Growth trajectories change significantly during childhood and especially during puberty.
Trends Matter More Than Single Numbers
Pediatricians are trained to look at the trend line, not individual measurements. A baby who has been tracking steadily along the 25th percentile for weight and suddenly drops to the 5th over two or three visits is a very different situation from a baby who has always been near the 5th.
The medical term for a significant downward shift is "faltering growth" (formerly called "failure to thrive"). An upward shift that crosses two or more major percentile lines can also warrant attention, as rapid weight gain relative to length may indicate overfeeding or, rarely, an endocrine issue. In most cases, however, gradual shifts are part of normal growth variability.
When to Worry
Talk to your pediatrician if you notice any of the following patterns:
- Weight, length, or head circumference drops across two or more major percentile lines over successive visits.
- Head circumference increases very rapidly or plateaus unexpectedly.
- Weight-for-length is consistently above the 98th or below the 2nd percentile.
- Your baby is not gaining any weight over a period of several weeks (outside of the normal initial weight loss after birth).
In the vast majority of cases, your pediatrician will reassure you that your baby is growing well. But raising concerns early is always the right move—early identification of issues allows for early intervention.
How Magerly Visualizes Growth Data
Keeping track of measurements between pediatrician visits can be challenging, especially when you are juggling feedings, naps, and everything else that comes with a new baby. Magerly makes it easy to log weight, length, and head circumference measurements and see them plotted on WHO-referenced growth charts right on your phone. You can spot trends at a glance, track how your baby's measurements evolve over weeks and months, and share the data with your pediatrician during check-ups.
The app's growth visualization is designed to reduce anxiety, not increase it. Instead of bombarding you with numbers, Magerly presents a clear, visual trend line that shows your baby's unique growth story. Combined with daily expert tips about nutrition and development, it gives you the context you need to feel confident about your child's progress.
The Bigger Picture
Growth charts are a valuable clinical tool, but they are only one piece of the puzzle. A baby who is eating well, meeting developmental milestones, has good energy, and is engaged with the world around them is almost certainly thriving—regardless of where they fall on a percentile chart. Use the charts as a guide, not a report card. Trust your pediatrician's clinical judgment, and remember that the goal is steady growth along your baby's own curve, whatever that curve happens to be.